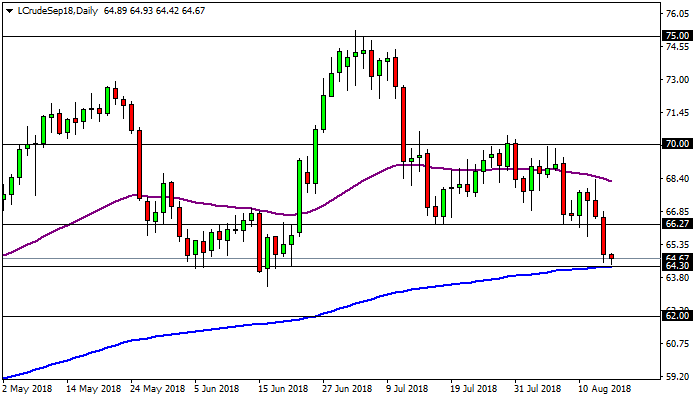
WTI oil
breaks below the 66.27 support zone and accelerates its bearish momentum
towards the 200 day EMA around the 64.30 level. We have been analyzing the
66.27 support zone since the first bullish bounce of the price and we also said
that the more visits we see to that level, the higher the probability of the
price breaking it to the downside. The 64.30 zone was a good support for the
commodity during a better part of June, therefore besides the 200 day EMA, the
64.30 level may also contribute to stall the bearish momentum on oil. In case
of a bullish bounce from the 200 day EMA, the 66.27 level could change from
support to resistance. Above the 66.27 level, oil will be entering again the
congestion area with a resistance at the 70.00 level. On the other hand, if WTI
oil breaks below the 200 day EMA, then it could fall to the 62.00 level.
Executable FX
Wednesday, August 15, 2018
Tuesday, August 14, 2018
Possible pullback on the Dollar Index
The Dollar
index is clearly overextended to the upside as shown on the daily chart. Once
the index broke above the 96.00 level, it accelerated its bullish momentum and
it is coming closer to the 97.00 level. Since the instrument is overbought, it
may be ready for a profit taking pullback, possibly from the 97.00 level. For
now, the 96.00 level is acting as its closest support, but if the index breaks
below the 96.00 level, then the 95.00 zone which was resistance in the past may
change to support. The angle and inclination of the 55 day EMA (purple line) is
showing us that the bullish trend is still in place and the instrument may try
to head higher.
Monday, August 13, 2018
Will the Dollar continue rallying?
The
US Dollar has been rallying on the back of the Turkish crisis which has been escalating,
putting pressure mainly on the Euro, which is more than 50% part of the Dollar
Index. The Turkish crisis has also put pressure on other main currencies and
emerging market currencies. On the daily chart of the Dollar index we can see
that the instrument broke above the 96.00 level, but the last daily candle is
in the shape of a doji. The doji is a Japanese candlestick pattern of
indecision. When a doji appears at the end of a trend, it may be telling us
that the trend is losing steam or a trend reversal is about to happen.
Therefore, the index may pull back below the 96.00 level in a profit taking
correction and maybe visit the 95.00 level. On the other hand, if the crisis
continues in Turkey, the Dollar may keep rallying and it may reach the 97.00
level, which could at as resistance.
Friday, August 10, 2018
One year lows on the EUR/USD
The EUR/USD
breaks below the 1.1500 level as shown on the daily chart and reaches the
1.1400 level. This is the first time the EUR/USD visits the 1.1400 level in a
year. The pair keeps its bearish trend and it may try to continue falling to
the 1.1300 level. On the other hand, the price may leave behind a false
breakout of the 1.1400 level and go back up in a correction. In case of a
pullback, the EUR/USD may find some resistance at the 1.1500 level, which was
support in the past. Above the 1.1500 level, its most relevant resistance is
the 55 day EMA around the 1.1676 level, which has been acting as a good
resistance. Above the 55 day EMA, its 200 day EMA at the 1.1835 level may also
act as resistance. Another possible scenario is that the EUR/USD may
consolidate between the 1.1400 level and the 1.1500 level without taking a
clear direction.
Thursday, August 9, 2018
Bullish breakout on the Dollar
The
Dollar index finally breaks out above the 95.00 level after almost three months
consolidated between that level as resistance and the 94.00 as support. The
Dollar index keeps its bullish trend, which never really reversed even with the
recent consolidation. The 55 day EMA is showing us that the bullish trend is
gaining strength. The index consolidated around the 95.00 level during four
sessions before breaking out, something that it did not do during the previous visits
to that level. The Dollar index breaks above the 96.00 level and if it
continues rallying, it may reach the 97.00 level, but it has not confirmed such
a breakout. In case of a pullback, the 95.00 level may become support for the
Dollar index. Fundamentally, the Dollar is still strong and it may continue
rallying during the upcoming week, but it may also try to correct the current
spike up.
Wednesday, August 8, 2018
Oil accelerates its bearish momentum
WTI
oil was consolidating around the 55 day EMA (purple line) for the last few
weeks, with the 70.00 level acting as a good resistance zone. Oil has been
pressured to the downside by the trade war between the United States and China.
The trade war has lowered the demand for oil from China, which is one of the
main commodities consumer in the world. The US oil exports to China have
dropped 70% in the last few months when the trade war started between the two
nations. The US oil inventories reading during today’s session showed that the
oil stockpiles have lowered somewhat, but the gasoline reserves have increased.
During today’s session, the price of WTI oil drops from to the 66.27 level,
which acted as support in the past and may hold the price again this time.
However, if WTI oil breaks below the 66.27 level, it may drop to the 200 day
EMA (blue line), around the 64.17 level. On the other hand, if the price
bounces to the upside, then the 70.00 level may act as resistance. Above the
70.00 level, WTI oil may have the road clear to visit again the peak at the
75.00 level.
Tuesday, August 7, 2018
Bitcoin accelerates its bearish momentum
The price
of Bitcoin continues to fall after the SEC postpone another decision on whether
or not to accept a Bitcoin ETF. Just 12 days ago, the SEC had already denied
another proposal for the creation of the first Bitcoin ETF, causing the price
of the cryptocurrency to drop below the 8000 level. The 200 day EMA (blue line)
at the 7769 level was holding the price temporarily, but the price falls to the
55 day EMA at the 7260 level. From the 55 day EMA, the price of Bitcoin makes a
bearish gap to fall to the 6717 level. On the daily chart of Bitcoin we can see
that its next support could be the 6000 level or the low at the 5769 level. On
the other hand, if the price retraces to the upside, the same 55 day EMA which
acted as support could change its role to resistance. Above the 55 day EMA, the
200 day EMA may also act as resistance.
Subscribe to:
Posts (Atom)
WTI oil at the 200 day EMA
WTI oil breaks below the 66.27 support zone and accelerates its bearish momentum towards the 200 day EMA around the 64.30 level. We have b...
-
As we approach the end of the Year and the coming of the new one, we start making a recollection of what we did and how we can do better. T...
-
Every week, ActivTrades has been providing excellent training and education on the financial markets through its team of professional trade...
-
The Dollar index is clearly overextended to the upside as shown on the daily chart. Once the index broke above the 96.00 level, it acceler...